
| www.flickr.com |
Types of Graphic Organizers
Star/web: Use it to show definitions, attributes, examples, and brainstorming.
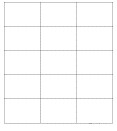
Chart/Matrix: Use it to show attributes, comparing and contrasting, and evaluating.
Tree/Map: Use it to show classifications, pedigrees, analysis, structures, attributes, examples, and brainstorming.
Chain: Use it to show processes, sequences, causes and effects, and chronology.
Sketch: Use it to show physical structures, descriptions of places, spatial relationships, concrete objects, and visual images.
Others are: Bridging, Snapshots, CerebralChart, Compare/Contrast, Tree, Spider Maps, Continuum Scale, Cycle, Problem/Solution, Outline, T-Charts, Fishbone Maps, Questions, Venn Diagrammes, Human Interaction, Outline Ranking, Series of Events.
Charts and Diagrams (first part)
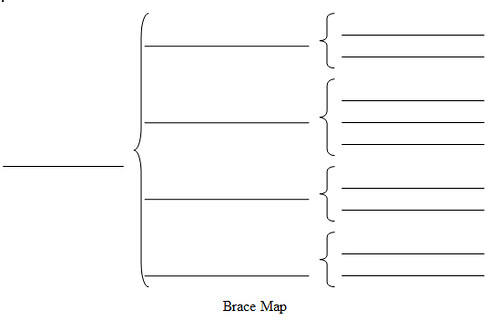
Brace Maps
* Brace Maps (also called Bracket Maps) used for Identifying Part/Whole Relationships.
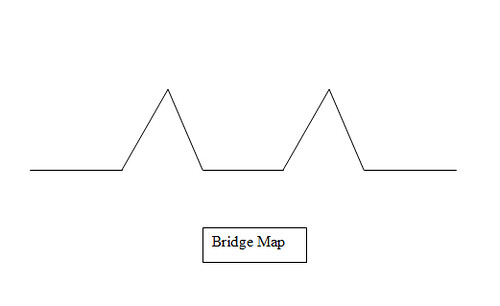
Bridge Maps
* Bridge maps are used for seeing Analogies
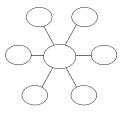
Bubble Maps
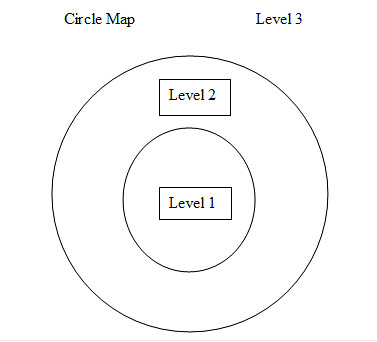
* Bubble maps (Circle maps) are used for Describing with Adjectives. See Star Maps below.
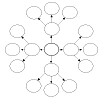
Cause and Effect Diagrams
* Cause and Effect diagrams, also called sequence of events diagrams or multi-flow maps, describe how events affect one another in a process.
There are many models of cause and effect events, including:
Disjointed Events - in which each cause has one effect.
One Cause Leading to Multiple Events - in which one cause has multiple effects.
Multiple Causes Leading to One Event - in which multiple causes have one effect (a fishbone diagram can be used for these).
Chain of Events - in which one event causes another, which triggers another, etc., like the domino effect.
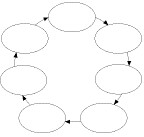
Cycle of Events - in which cyclic causes/effects are repeated, like a feedback loop.
More Complex Events - in which multiple causes and effects interact.

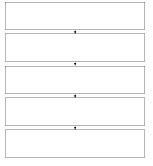
Chain Maps
* Chain diagrams, also called sequence of events diagrams or Flow Maps, describe the stages or steps in a process and are useful in examining linear cause-and-effect processes and other processes that unfold sequentially.
Charts
* Chart diagrams (also called matrix diagrams or tables) condense and organize data about multiple traits associated with many items or topics. Charts can be used to show attributes of items, to compare and contrast topics, and to evaluate information.
Circle Maps
* For Defining in Context (similar to Oval Star Maps).
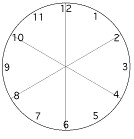
Clock Maps

Cluster Maps
* Cluster diagrams (also called cloud diagrams) can help to systematize the generation of ideas based upon a central topic. Using this type of diagram, the student can more easily brainstorm a theme, associate about an idea, or explore a new subject.
Continuum Maps
* Continuum or timeline diagrams are used to represent a continuum of data that occur in chronological (time) order or in sequential order. Use a continuum map if the topic has a definite beginning and/or ending points and the data points in between are not discrete.
Cyclic Maps
* Cycle Diagrams show how items are related to one another in a repeating cycle. Use a cycle diagram when there is no beginning and no end to a repeating process. In making a cycle diagram, the student must identify the main events in the cycle, how they interact, and how the cycle repeats.


No hay comentarios :
Publicar un comentario