
| www.flickr.com |
Double Bubble Maps
* For Comparing and Contrasting
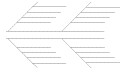
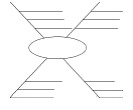
Fishbone Maps
* A fishbone map (also called a herringbone map) is used to explore the many aspects or effects of a complex topic, helping the student to organize their thoughts in a simple, visual way. The use of color helps make a fishbone map clearer and easier to interpret.
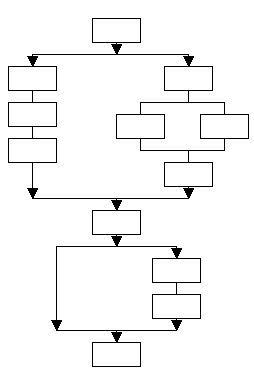
Flowcharts
* Flowchart diagrams (also called entity relationship diagrams) visually display a chain of instructions used to complete an algorithm or other complicated process.
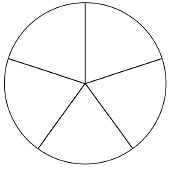
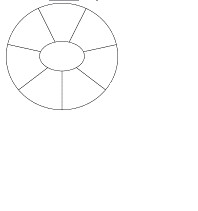
Pie Charts
* Pie chart diagrams (also called circle graphs) are useful for displaying information about the percentages or parts of a whole.
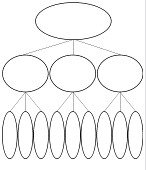
Spider Maps
* A Spider map (also called a semantic map) is used to investigate and enumerate various aspects of a single theme or topic, helping the student to organize their thoughts. Called a Spider Map because it looks a bit like a spider's web.
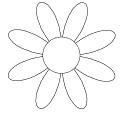
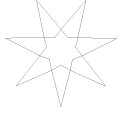
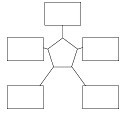
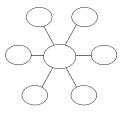
Star Maps
* Star diagrams are useful for basic brainstorming about a topic or listing all the major traits related to a theme. Star maps do not have to be "star-shaped", but always have a central region with other areas radiating out from this. Normal formats are: 5 to 8 Stars, 5 to 8 Circles, 4 to 8 Squares, 5 to 8 Petals, 5 to 8 Ovals.
T-Charts
* T-Charts are a type of chart in which a student lists and examines two facets of a topic, like the pros and cons associated with it, its advantages and disadvantages, facts vs. opinions, etc.

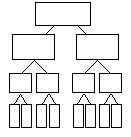
Tree Maps
* Tree Diagrams show how items are related to one another.
The tree's trunk represents the main topic, and the branches represent relevant facts, factors, influences, traits, people, or outcomes. Tree diagrams can be used to sort items or classify them. A family tree is an example of a tree diagram.
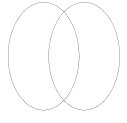
Venn Diagrams
* A Venn Diagram is made up of two or three overlapping circles.
In mathematics, Venn diagrams are used to visualize the relationship between two or three sets. Venn diagrams can also be used to compare and contrast the characteristics of other items, like groups of people, individual people, books, characters, animals, etc.
Y-Charts
* Y-Charts are a type of three-part chart.
http://www.eduplace.com/graphicorganizer/
http://www.teachervision.fen.com/graphic-organizers/printable/6293.html
http://www.enchantedlearning.com/graphicorganizers/
Many other sites are available on the web. Do a Google or Yahoo search for "Graphic organizers".
Recuperation of KMV 4 and 5:
Part 4
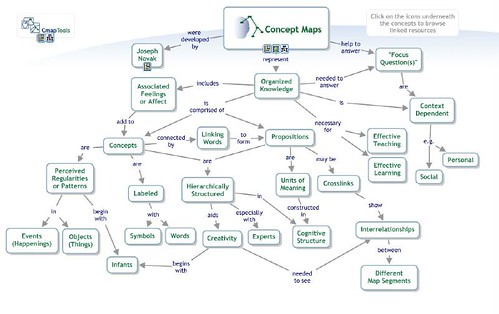
Concept mapping
Concept maps visualize the relationships between different concepts.
* Supposed to be a map, a system view, of a real (abstract) system or set of concepts.
* Concept map grows within a context frame defined by an explicit "focus question"
* Use linking phrases, e.g., "gives rise to", "results in", "is required by", "contributes to", etc.
* Represent the mental models, i.e., the cognitive map of individuals, teams and organizations.
* Represent the structure of knowledge gleaned from written documents.
* Aid creativity
* Used for brain-storming
* Communicate complex ideas
* Used in software design
* A first step in ontology-building
* Can also be used flexibly to represent formal argument.
Copyright (c) 1998-2006 Florida's Institute for Human & Machine Cognition (IHMC)
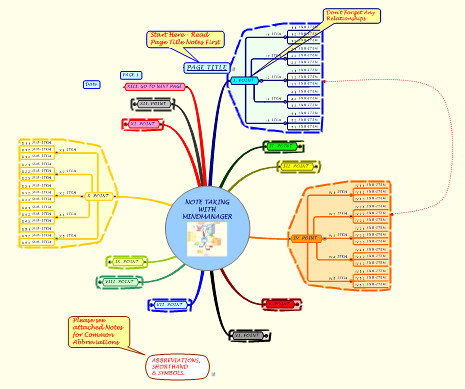
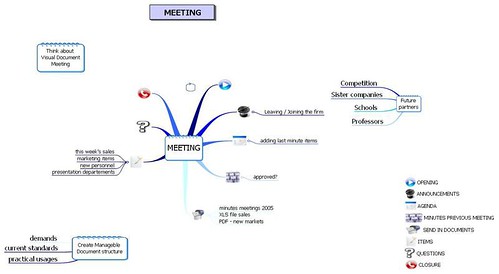
Mind mapping
Radial hierarchies and tree structures similar to a semantic network or cognitive map, also called "Webs" or "Webbing"
* a diagram used to represent words, ideas, tasks or other items
* linked to and arranged radially around a central key word or idea
* used to generate, visualize, structure and classify ideas,
* used as an aid in study, organization, problem solving, and decision making
* an image-centered diagram
* no formal restrictions on the kinds of links used.
* the map involves images, words, and lines
* most important points or keywords
* elements are arranged intuitively according to the importance of the concepts
* organized into groupings, branches, or areas
* used for note-taking,
* brainstorming
* summarizing
* revising
* clarifying of thoughts
* a mnemonic technique
* colour pen creativity sessions
Concept mapping
Concept maps visualize the relationships between different concepts.
* Supposed to be a map, a system view, of a real (abstract) system or set of concepts.
* Concept map grows within a context frame defined by an explicit "focus question"
* Use linking phrases, e.g., "gives rise to", "results in", "is required by", "contributes to", etc.
* Represent the mental models, i.e., the cognitive map of individuals, teams and organizations.
* Represent the structure of knowledge gleaned from written documents.
* Aid creativity
* Used for brain-storming
* Communicate complex ideas
* Used in software design
* A first step in ontology-building
* Can also be used flexibly to represent formal argument.
Copyright (c) 1998-2006 Florida's Institute for Human & Machine Cognition (IHMC)
Mind mapping
Radial hierarchies and tree structures similar to a semantic network or cognitive map, also called "Webs" or "Webbing"
* a diagram used to represent words, ideas, tasks or other items
* linked to and arranged radially around a central key word or idea
* used to generate, visualize, structure and classify ideas,
* used as an aid in study, organization, problem solving, and decision making
* an image-centered diagram
* no formal restrictions on the kinds of links used.
* the map involves images, words, and lines
* most important points or keywords
* elements are arranged intuitively according to the importance of the concepts
* organized into groupings, branches, or areas
* used for note-taking,
* brainstorming
* summarizing
* revising
* clarifying of thoughts
* a mnemonic technique
* colour pen creativity sessions
Part 5
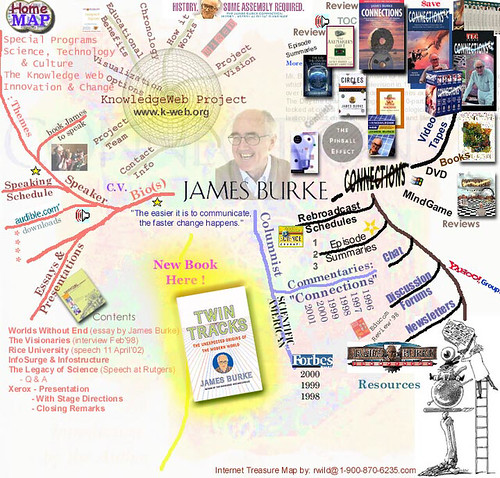
Image Mapping
Image maps are graphics that have a series of links hidden in them. An image is "mapped" into a series of coordinates that represent the individual pixels that make up an image. Areas of the image can then be designated "hot spots" (the equivelent of a graphical link) such that when a user clicks the mouse between a series of "hot" coordinates they are taken to a new location. Clicking another part (or series of coordinates) of the same image will take them to a different location.
There are two kinds of image maps that are possible to create: server side image maps and client side image maps. The difference between the two comes down to which computer calculates the coordinates of where a user clicks the mouse on an image. Server side image maps require use of a special software (CGI) program running on the server to calculate the coordinates and give them to the browser. Client side image maps require no special software to execute. The only reason to run a server side image map is to accomodate users who have old browsers that do not support client side image maps. The last several versions of both Netscape Navigator and Microsoft Internet Explorer all support client side image maps.
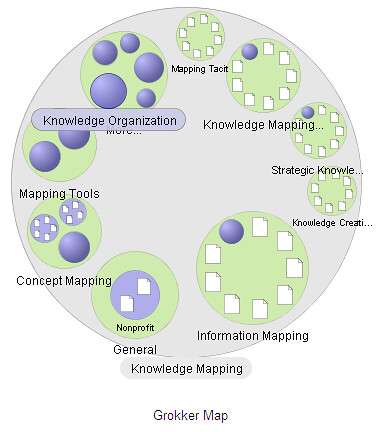
Information Clustering and Browser Mapping
Browser Mapping, Information Space Maps, Visual Search Tools.
* Online mapping techniques that represent graphically the results of web browsing.
* Larger circles represent higher significance.
* Clustering puts results into useful categories.
* Visualization makes it easier to see the relationships between results.
* Filtering allows the user to quickly pinpoint specific links and documents.
* Show and open links to all documents found.
 Summapping
A new term for a modified mapping technique developed by Arjen ter Hoeve, author of podcasts and training materials focused on mind mapping. He has written an e-book on this visual mapping technique which he has developed.
He defines a summap as "a collection of logically, non linear organised information which is arranged by (direct) relationships and position".
Summapping is the natural evolution of proven visual mapping techniques like conceptmapping and mindmapping. It looks a lot like mind-mapping (borrowing a lot of concepts and practices from both mind-mapping and concept mapping), except that maps can contain items that may be closely related to one another which are located in close proximity in the diagram, but don't always need to be joined using connector lines.
The techniques of gSummappingh are to:
* Provide a more flexible medium for recording information and ideas (by creating collections of information that aren't necessarily tied to a rigid, connected hierarchy)
* Make the contents of visual maps easier for others to understand (by incorporating a standardized set of map symbols and mapping conventions)
* Capture more information in a compact format (both more map elements, as well as a greater variety of content).
* Show the not-immediately or not-related information in close proximity ? mindmaps and conceptmaps donft do this (there is no association between them).
Please see BrainBox and CmapTools under gAvailable Free Methods and Softwareh for methods for making Summaps. Both BrainBoxes MapEdit and CmapTools are programs that can incorporate "floating" topics, so you can try out this technique.
http://www.summap.org/
http://blog.summap.org/
http://blog.mindmap-software.com/
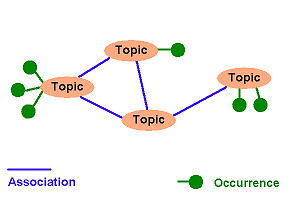
Topic Mapping
Groupings of addressable information objects around topics (occurrences)
Topic maps refer to the ISO standard (ISO/IEC 13250:2003).
* structural information
* relationships between topics (associations)
* defines a multidimensional topic space
* in which the locations are topics
* in which the distances between topics are measurable in terms of the number of intervening topics which must be visited in order to get from one topic to another
* kinds of relationships that define the path from one topic to another, if any, through the intervening topics, if any
http://en.wikipedia.org/wiki/Topic_map
http://www.topicmap.com/topicmap/resources.html
http://www.ontopia.net/topicmaps/materials/tao.html
Image Mapping
Image maps are graphics that have a series of links hidden in them. An image is "mapped" into a series of coordinates that represent the individual pixels that make up an image. Areas of the image can then be designated "hot spots" (the equivelent of a graphical link) such that when a user clicks the mouse between a series of "hot" coordinates they are taken to a new location. Clicking another part (or series of coordinates) of the same image will take them to a different location.
There are two kinds of image maps that are possible to create: server side image maps and client side image maps. The difference between the two comes down to which computer calculates the coordinates of where a user clicks the mouse on an image. Server side image maps require use of a special software (CGI) program running on the server to calculate the coordinates and give them to the browser. Client side image maps require no special software to execute. The only reason to run a server side image map is to accomodate users who have old browsers that do not support client side image maps. The last several versions of both Netscape Navigator and Microsoft Internet Explorer all support client side image maps.
Information Clustering and Browser Mapping
Browser Mapping, Information Space Maps, Visual Search Tools.
* Online mapping techniques that represent graphically the results of web browsing.
* Larger circles represent higher significance.
* Clustering puts results into useful categories.
* Visualization makes it easier to see the relationships between results.
* Filtering allows the user to quickly pinpoint specific links and documents.
* Show and open links to all documents found.
A new term for a modified mapping technique developed by Arjen ter Hoeve, author of podcasts and training materials focused on mind mapping. He has written an e-book on this visual mapping technique which he has developed.
He defines a summap as "a collection of logically, non linear organised information which is arranged by (direct) relationships and position".
Summapping is the natural evolution of proven visual mapping techniques like conceptmapping and mindmapping. It looks a lot like mind-mapping (borrowing a lot of concepts and practices from both mind-mapping and concept mapping), except that maps can contain items that may be closely related to one another which are located in close proximity in the diagram, but don't always need to be joined using connector lines.
The techniques of gSummappingh are to:
* Provide a more flexible medium for recording information and ideas (by creating collections of information that aren't necessarily tied to a rigid, connected hierarchy)
* Make the contents of visual maps easier for others to understand (by incorporating a standardized set of map symbols and mapping conventions)
* Capture more information in a compact format (both more map elements, as well as a greater variety of content).
* Show the not-immediately or not-related information in close proximity ? mindmaps and conceptmaps donft do this (there is no association between them).
Please see BrainBox and CmapTools under gAvailable Free Methods and Softwareh for methods for making Summaps. Both BrainBoxes MapEdit and CmapTools are programs that can incorporate "floating" topics, so you can try out this technique.
http://www.summap.org/
http://blog.summap.org/
http://blog.mindmap-software.com/
Topic Mapping
Groupings of addressable information objects around topics (occurrences)
Topic maps refer to the ISO standard (ISO/IEC 13250:2003).
* structural information
* relationships between topics (associations)
* defines a multidimensional topic space
* in which the locations are topics
* in which the distances between topics are measurable in terms of the number of intervening topics which must be visited in order to get from one topic to another
* kinds of relationships that define the path from one topic to another, if any, through the intervening topics, if any
http://en.wikipedia.org/wiki/Topic_map
http://www.topicmap.com/topicmap/resources.html
http://www.ontopia.net/topicmaps/materials/tao.html
Here are the complete PhotoBrowsers for the complete series of KMV, 1-5, 6-10 and 11-15:
Get the flash player here: http://www.adobe.com/flashplayer
Get the flash player here: http://www.adobe.com/flashplayer
Get the flash player here: http://www.adobe.com/flashplayer


No hay comentarios :
Publicar un comentario